 |
Fabry–Perot interferometer based Mie Doppler lidar for
low tropospheric wind observation
Abstract:
Similar in principle to recent implementations of a lidar system at 355 nm [Opt. Lett. 25, 1231 (2000),
Appl. Opt. 44, 6023 (2005)], an incoherent-detection Mie Doppler wind lidar at 1064 nm was developed
and deployed in 2005 [Opt. Rev. 12, 409 (2005)] for wind measurements in the low troposphere, taking
advantage of aerosol scattering for signal enhancement. We present a number of improvements made to
the original 1064 nm system to increase its robustness for long-period operation. These include a multimode
fiber for receiving the reference signal, a mode scrambler to allow uniform illumination over the
Fabry–Perot interferometer, and a fast scannable Fabry–Perot interferometer for calibration and for the
determination of outgoing laser frequency during the wind observation. With these improvements in
stability, the standard deviation of peak transmission and FWHM of the Fabry–Perot interferometer was
determined to be 0.49% and 0.36%, respectively. The lidar wind measurements were validated within a
dynamic range of ±40 m/s. Comparison experiments with both wind profiler radar and Vaisala
wiresonde show good agreement with expected observation error. An example of 24 h continuous observations
of wind field and aerosol backscatter coefficients in the boundary layer with 1 min and 30 m
temporal and spatial resolution and 3 m/s tolerated wind velocity error is presented and fully demonstrates
the stability and robustness of this lidar.
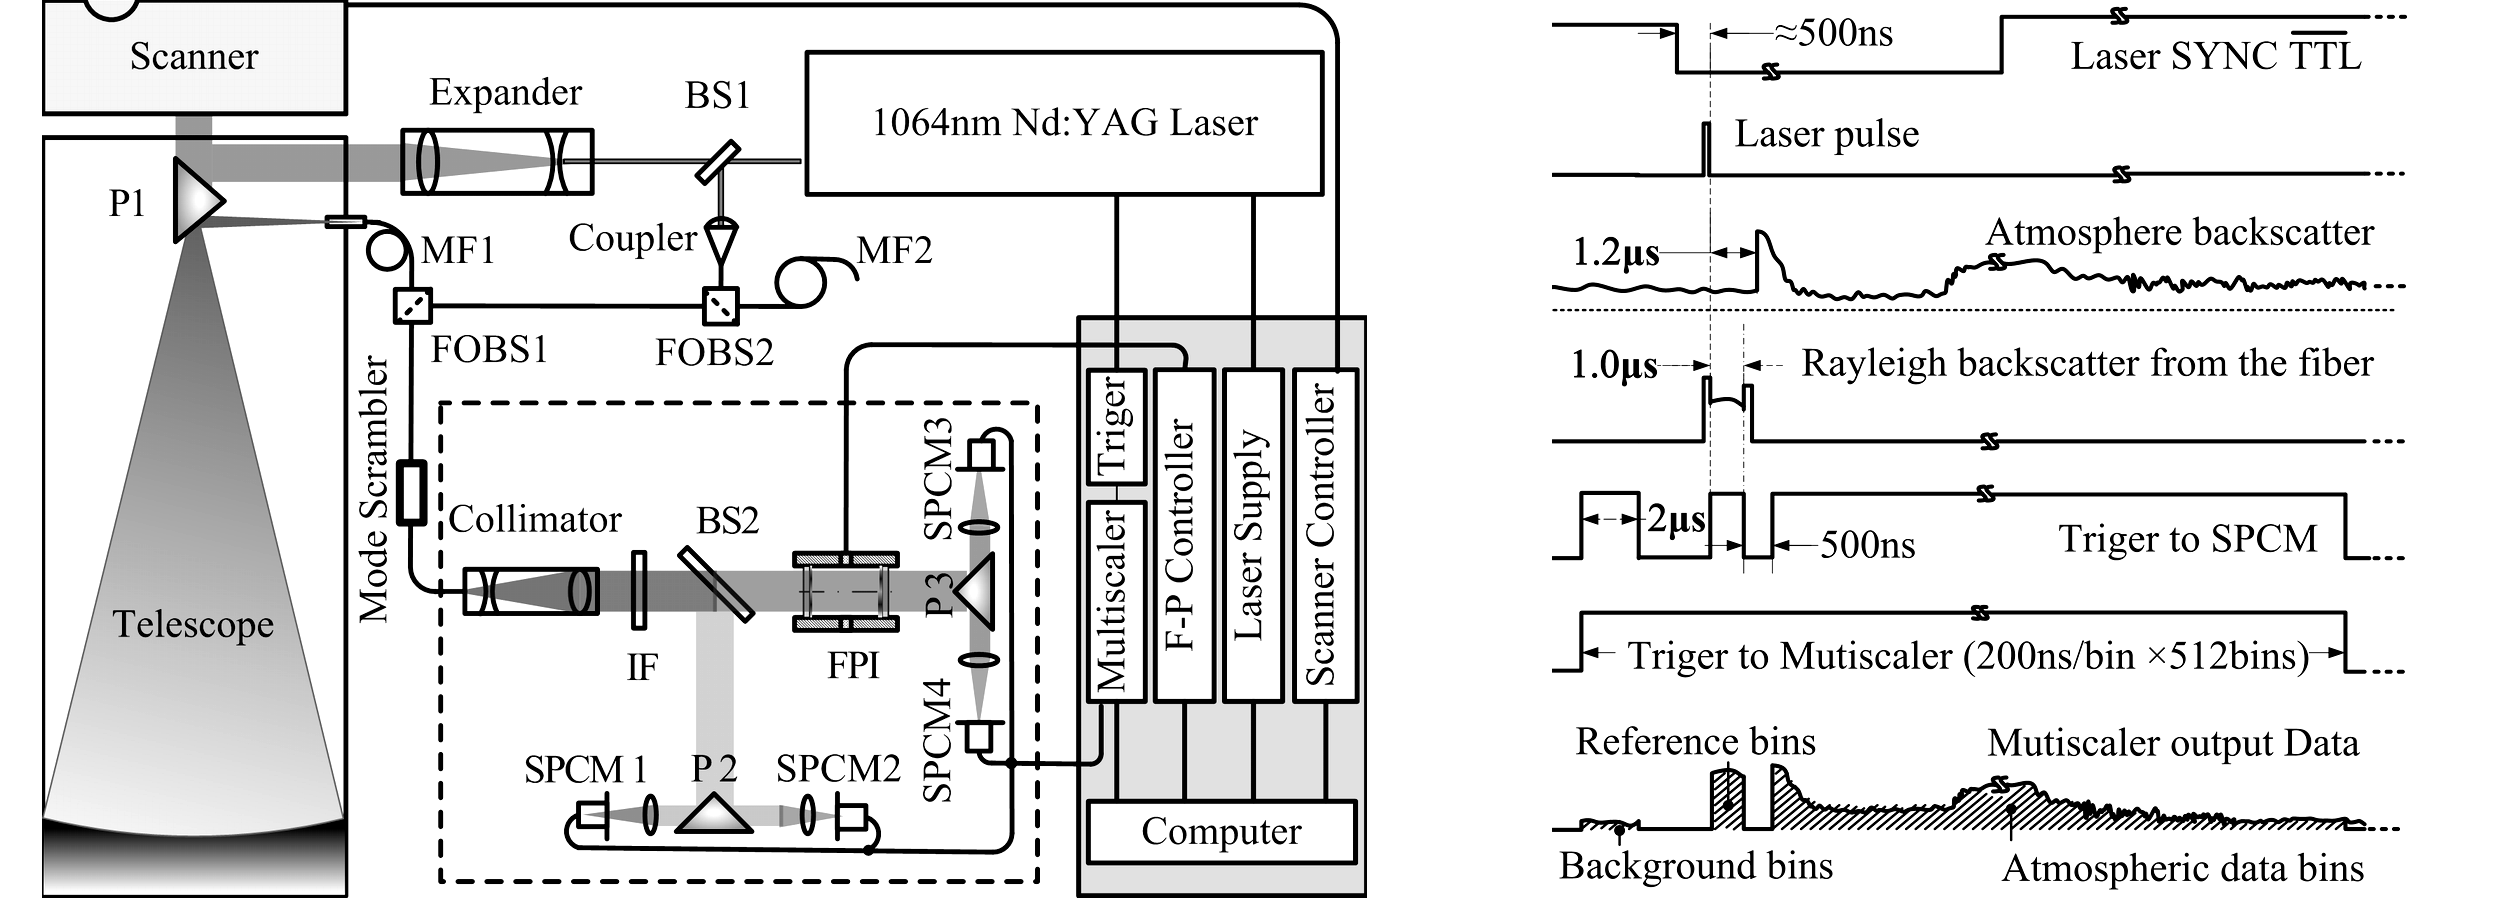
Fig. 1. Schematic of the lidar system: BS, beam splitter; P, prism; MF, multimode fiber; FOBS, fiber-optic beam splitter; IF, interference filter; SPCM, single photon counting mode; FPI, Fabry–Perot interferemeter
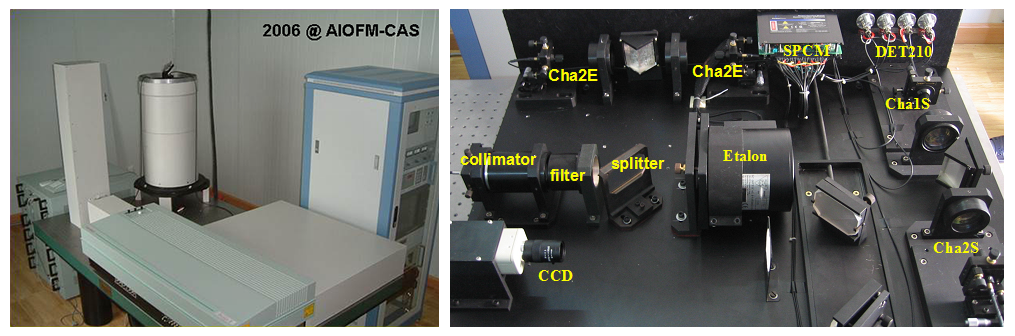
Fig. 2. Instruments of the system.
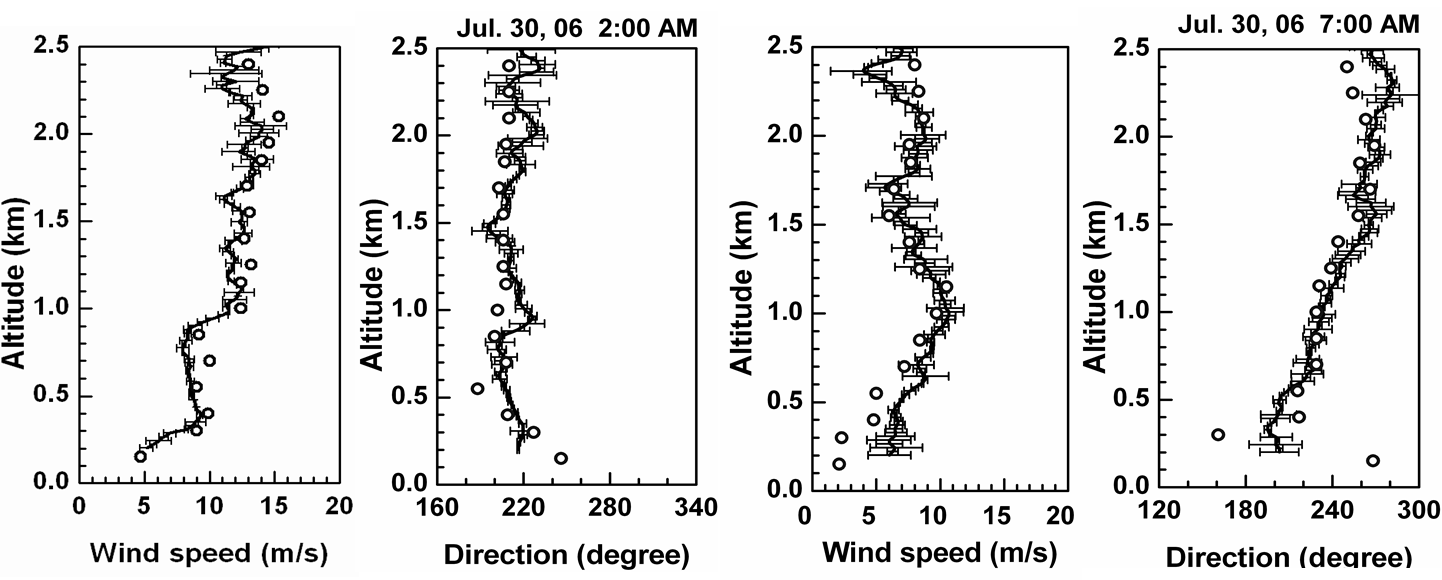
Fig. 3. Horizontal wind and direction profiles measured by Doppler wind lidar (solid curve) and wind profiler radar (circle).
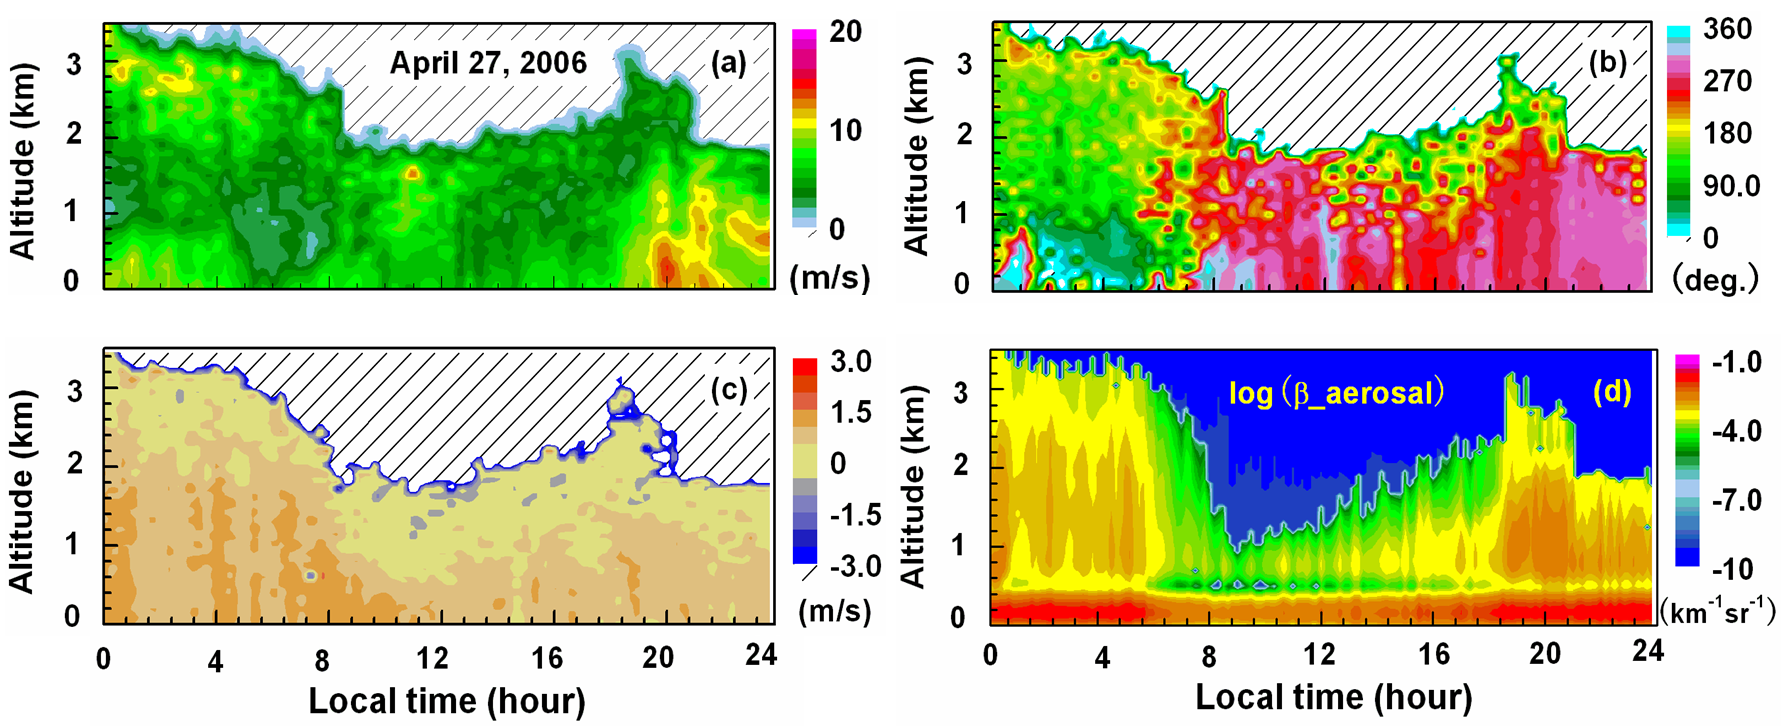
Fig. 4. 24 h observation of wind field and aerosol backscatter coefficient on 27 April 2006: (a) time-height plot of horizontal wind velocity, (b) wind direction, (c) vertical wind velocity, (d) time– height plot of aerosol backscatter coefficients in logarithmic scale.
